Sales teams need visibility, accountability, and performance insights to close deals faster—and Interakt’s Sales CRM Reports provide just that. This built-in feature eliminates the need for spreadsheets or external tools by offering a centralized, intuitive dashboard to track agent performance, analyze lead movement, and understand the health of the sales funnel.
Designed for sales enthusiasts, these reports empower teams to take data-backed decisions, boost productivity, and identify areas for recognition or intervention—without relying on manual tracking or guesswork.
Why Use Sales CRM Reports?
Sales CRM Reports in Interakt help:
-Track performance of individual agents and entire teams over time
-Monitor lead movement across sales pipeline stages
-Detect bottlenecks or stagnation in the funnel
-Understand workload distribution within teams
-Recognize high performers and uncover training needs
-Download reports for internal reviews and meetings
This feature supports operational clarity and ensures every contact is being effectively managed.
Video Walkthrough:
Step by Step Guide:
Step 1: Access Sales CRM Reports
To begin reporting and analysis:
–Log in to the Interakt Dashboard
–Go to the Sales CRM section
–Click on Sales CRM Reports
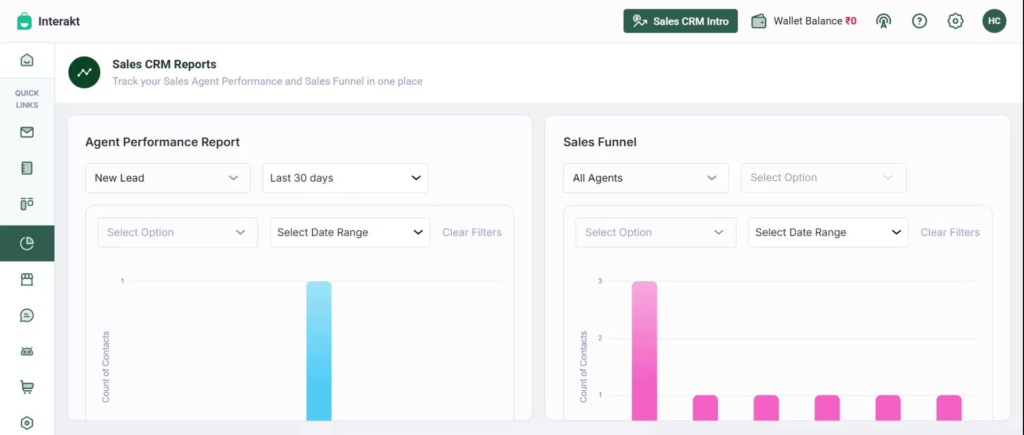
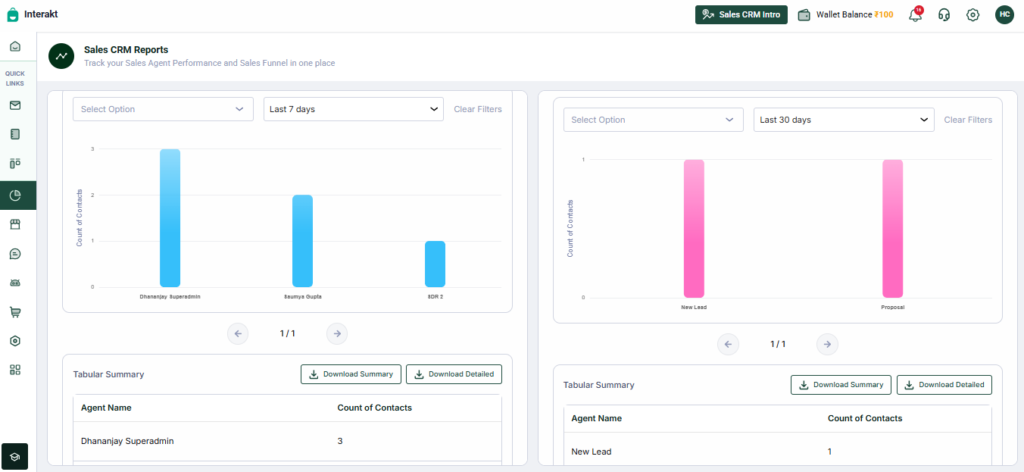
This section serves as the reporting hub with two key report types:
-Agent Performance Report: Tracks contacts handled by each agent across various statuses
-Sales Funnel Report: Visualizes lead distribution across pipeline stages by agent or team
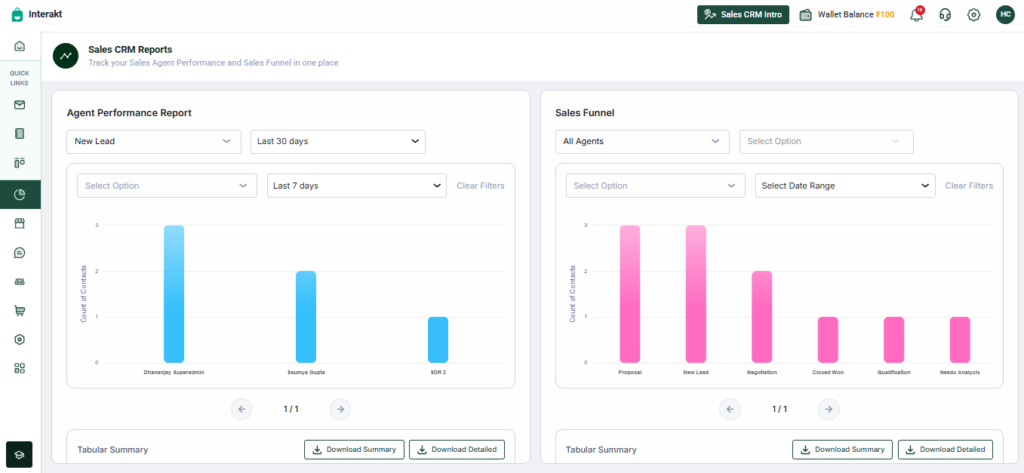
Step 2: Filter, Analyze & Track Sales Performance
To gain meaningful insights from reports, apply filters to focus the analysis. After selecting a report type—Agent Performance or Sales Funnel—filters can be used to refine the data.
Mandatory Filter:
-Date Range – This is required for all reports. Select a range such as “Last 7 days” or “Last 30 days” to define the time period for your analysis.
Optional Filters (enhance report depth):
-Lead Status – Use this to view movement into specific stages (e.g., Closed Won, Under Qualification) during the selected period.
-Contact Creation Date or Due Date – Helpful to prioritize follow-ups or see lead generation trends.
-Agent or Team – Choose to view performance for specific agents, a team, or the entire sales org (visible based on user role and access).
* Access is role-based.
-Sales Agents see only their assigned leads
-Sales Leads can view their team’s data
-Super Admins access the full system-wide report
Key Use Cases:
-Agent Performance – Track how many leads are assigned to each sales agent and how many have been closed successfully. This report provides a snapshot of agent-wise activity across the sales pipeline.
Example:
–In the Agent Performance Report, filter by status “Closed Won” for the last 30 days. This reveals how many deals each agent successfully closed during that time. For instance, if Agent A closed 12 leads and Agent B closed only 3, it may indicate a performance gap or a need for training/support.
This insight helps managers reward high performers and provide coaching where needed—ensuring consistent growth across the team.
-Sales Funnel: Visualize the number of leads across each sales stage (New Lead, Under Qualification, etc.) for a team, an agent, or the full sales org. This helps identify which leads are progressing and where bottlenecks exist.
Example:
–Select the Sales Funnel Report for the Outbound Sales team over the last 14 days. The report shows that 70% of leads are stuck in “Under Qualification” and haven’t moved forward. This indicates stagnation—possibly due to delays in outreach or lack of follow-up tasks.
–The report also shows Agent C has 40 leads in “New Lead” but hasn’t progressed many to later stages, suggesting they may be overburdened or need help prioritizing leads.
These filters help break down large volumes of data, enabling faster decisions and better visibility into team performance.
Step 3: Download Summary or Detailed Reports
After applying filters and analyzing the data, reports can be downloaded for offline review, team discussions, or performance reviews.
How to do it:
Scroll to the bottom of the report view.
-Summary Report:
Provides an overview of lead counts across statuses.
Useful for quick reviews, management reporting, or status snapshots.
-Detailed Report: Includes data such as – Contact Name, Contact Creation Date, Account Owner, Report Status, Report Status Updated At, Current Status, Current Status Updated At .
Ideal for deeper analysis, sharing with stakeholders, or maintaining audit trails.
These reports help export exactly what’s visible on-screen and enable tracking performance across agents, teams, or specific lead groups.
Conclusion:
Sales CRM Reports in Interakt are essential for maintaining clarity and control in the sales process. They provide real-time visibility into agent performance, lead movement, and overall pipeline health. With powerful filters, downloadable summaries, and team-specific views, they enable better decisions, fair lead distribution, and focused follow-ups. Whether identifying bottlenecks or recognizing top performers, these reports offer the insights needed to scale sales operations efficiently and effectively.